Segment 1: How to Build the First Layer
From Organizational Data to Cost Pool Structure
This segment introduces the foundational layer of any cost model: the Cost Pools. You’ll learn how to translate organizational and financial data into a structured, repeatable view that supports all downstream modeling and reporting.
Introduction: Why a Strong Foundation is Important
Visual Cues and Outcome Markers
What is a Cost Model?
Data
Logic
Methods for Cost Modeling
What is the Cost Pool Layer?
How to Build the Cost Pools Layer
Data Required to Build the Cost Pools Layer
The Chart of Accounts (CoA)
How to Read a Chart of Accounts (CoA) Hierarchy
The Cost Pool List
Primary Cost Pools
Constructing a Cost Pool Reference Dataset from the Chart of Accounts
Applying the Cost Pools Reference Dataset to Financial Data
Obtaining the Financial Datasets from Source Systems
Joining the Reference Dataset to Financial Data
Governance and Partnership with Finance
Cost Model Snapshot
Contents
Introduction: Why a Strong Foundation is Important
Effective cost models, whether developed for ITFM, TBM, or broader enterprise finance, are built on a simple principle: the reliability of the outcomes is only as strong as the reliability of the foundation beneath them.
A model built on incomplete data, unclear definitions, or inconsistent logic will always struggle to support advanced analysis. But a model built on disciplined foundations can scale into more sophisticated capabilities such as unit cost analysis, service costing, scenario modeling, and strategic investment planning.
This guide is designed to help practitioners, finance partners, and technology leaders understand how to construct and apply a cost model in a way that reliably supports organizational outcomes. It focuses first on the foundational elements of data, tools, and methods that support effective modeling and provides context for how the model fits within broader financial and operational practices.
Starting with the basics, the guidance that follows explains what a cost model is, why it matters, and how organizations can construct a reliable first layer that supports both traditional financial reporting and consumption aligned analysis. Each step builds on the last, showing how the model connects to real-world use cases and how those use cases inform the decisions technology and finance leaders need to make.
What follows is designed to be applicable regardless of which tools or frameworks your organization uses. It takes a standards-aligned approach, drawing on well-established practices from ITFM, FinOps, ITSM, TBM, CSDM, Agile, and other operational frameworks to strengthen the model without depending on any single one. These standards provide structured data, shared definitions, and operational discipline that improve the accuracy and reliability of cost modeling. While the guide does not explore any one framework in depth, it highlights where these connected practices inform the model and enhance the insights it is able to produce.
Visual Cues and Outcome Markers
Throughout this guide, icons and callouts highlight which outcomes each modeling step supports whether transparency, insight generation, benchmarking, strategic alignment, or operational optimization. These cues clarify not only how to build each component of the model, but why it matters and which decisions it supports across the organization.
Transparency: Clear, traceable views of cost and consumption that support confident, informed decisions
Insight Generation: Clear understanding of how technology costs and capabilities influence business performance
Benchmarking: Evaluation of cost and performance outcomes against peer organizations and established standard
Strategic Alignment: Ensuring technology spending and programs directly support business goals and strategic outcomes
Operational Optimization: Cross‑functional alignment around shared priorities, tradeoffs, and operational improvements
What Is a Cost Model?
A cost model is a structured set of mathematical relationships that transforms raw financial, operational, and consumption data into meaningful insights that support data driven financial decision making. It provides a disciplined way to organize inputs, define relationships, and represent how resources are consumed and what they cost. When constructed well, a cost model becomes a reliable analytical framework that explains cost behavior and supports both financial and operational decisions.
At its core, every cost model relies on two foundational components: data and logic.
Data
Data provides the factual basis for modeling. It describes:
What was spent (financial data)
What was used or consumed (operational and consumption data)
What was delivered (performance or output data)
For a cost model to function effectively, these inputs must be complete, reliable, and structured in a way that supports consistent interpretation across periods.
Note on Data Completeness
A cost model does not require perfect data to make meaningful progress. It requires data that is complete enough to establish the necessary relationships between financial, operational, and consumption inputs. Early modeling work often surfaces gaps, and this is expected. Incomplete data should be presented factually and transparently, not as a critique of data owners, but as a clear view into where additional structure or definition is needed.
The goal is to help stakeholders understand:
Which relationships can be established today
Where gaps exist
How those gaps affect the model’s ability to represent cost behavior
By framing data gaps objectively, as part of the modeling process rather than a failure of stewardship, teams can collaborate more effectively. This approach builds trust, reduces defensiveness, and helps technology, finance, and business partners see how the current state of their data does or does not support transparency and insight generation.
Logic
Logic defines the rules, relationships, and mathematical methods that determine how cost flows from a source cost element (such as a general ledger account, contract, or labor record) to a target cost element (such as a cost category, resource grouping, or service).
Logic establishes:
How data sets relate to one another
Which attributes or drivers are relevant
What constitutes an appropriate basis for assigning or allocating cost
How to maintain consistency and repeatability over time
Logic is where domain expertise becomes essential. To be credible, the model must reflect how the organization actually operates.
Methods for Cost Modeling
Cost modeling methods combine data and domain expertise to define the mathematical approaches that move cost through the model. These methods determine how cost is assigned or allocated from source to target in a way that is:
Accurate and reflects how the business actually works
Defensible and is transparent and aligned with standards
Repeatable remaining consistent across cycles
Meaningful because it supports the insights and decisions the model is intended to enable
Common methods include:
Direct assignment, when a cost can be traced to a single target
Attribute‑based assignment, when metadata or operational data defines the relationship
Driver‑based allocation, when cost must be distributed using a measurable basis such as consumption, capacity, or utilization
Now that you understand the purpose and value of the Cost Pools layer, the next step is to build it. This begins with gathering the right financial and organizational datasets, enriching them with a consistent classification structure, and validating the results with Finance. The sections that follow walk through each part of this process.
What is the Cost Pools Layer?
The Cost Pools layer is where a cost model begins. It groups technology expenses by what the organization actually buys, like labor, services, cloud, hardware, software, facilities, telecom, and internal allocations, so the model reflects the true composition of spend. Because these categories often map directly to general ledger accounts, this layer provides a clear, reliable foundation for all downstream analysis and reporting.
Because it represents the underlying composition of spend, the Cost Pools layer is typically the first step in building a cost model. It provides the structural basis for financial and operational views by organizing costs in a way that is consistent, auditable, and aligned to the organization’s general ledger and reporting practices.
Cost pools are categories of spend, and organizations typically align their labels to the frameworks they follow. Practitioners not following a specific framework can reference public‑domain classifications such as those defined in NIST SP 800‑53 and NIST SP 500‑292, which outline commonly recognized categories of IT assets and services.¹
Organizational finance is typically concerned with P&L management, and common views focus on spend by area of accountability or by reporting period. These lenses help answer questions like “How much did we spend?” or “Who is spending more or less?”
Modeling spend through cost pools introduces a different lens that deepens the narrative beyond totals and variances. It enables organizations to answer a more foundational question: What did we buy? This shift allows finance and technology teams to analyze spend by the nature of cost, rather than through the organization’s accounting structure alone.
Finance teams bring deep expertise in reporting structures, organizational hierarchies, spend‑classification policies, and the systems that support them. Technology teams, however, often have limited visibility into these structures. The complexity of financial processes, controls, and analysis can be difficult to navigate without direct exposure, and important nuances are easily lost across functional boundaries.
Cost pools introduce the first meaningful opportunity for cross‑functional communication in the modeling process by offering a shared language that both Finance and Technology can use without requiring deep fluency in each other’s domains. By grounding conversations in what the organization actually buys, they make financial data more accessible to technology leaders and help both groups engage more effectively in discussions about cost accountability, investment decisions, and strategic alignment.
Notes on Why Cost Pools Matter
How to Build the Cost Pools Layer
Now that we’ve defined what a cost model is, why it matters, and how the Cost Pools layer functions as the model’s foundation, the next step is to build it. Constructing this layer requires two things:
The right data
A clear, repeatable method
The goal is to create a structured, auditable view of what the organization buys, grounded in its financial master data and aligned to a consistent classification structure.
Data Required to Build the Cost Pools Layer
Building the Cost Pools layer begins with assembling the datasets that describe how the organization categorizes its money and how those categories map to the cost pool structure. These datasets form the backbone of the model because they allow us to classify, group, and align costs in a way that is consistent with existing financial processes.
Two datasets are essential:
The Chart of Accounts
The list of Cost Pools you will use
The Chart of Accounts (CoA)
A Chart of Accounts is the organization’s master list of financial accounts or categories. It’s the structured vocabulary used to record, track, and report every financial transaction. It is the authoritative source for understanding what the organization spends money on.
Think of the CoA as the labeling system for a very large filing cabinet: each account label tells you what type of financial activity belongs inside.
Every organization structures its CoA a little differently, but most include key categories such as Capital Expenditures (CapEx) and Operating Expenditures (OpEx), hierarchical rollups that group accounts into broader categories, and additional attributes that indicate what type of spending each category represents.
You do not need the entire enterprise CoA if the organization is large or complex. Instead, extract only the accounting segments relevant to the scope of your model. For example, only OpEx, a specific region or division, or only IT‑owned accounts. This keeps the dataset manageable and reduces noise during classification.
A typical CoA extract should include:
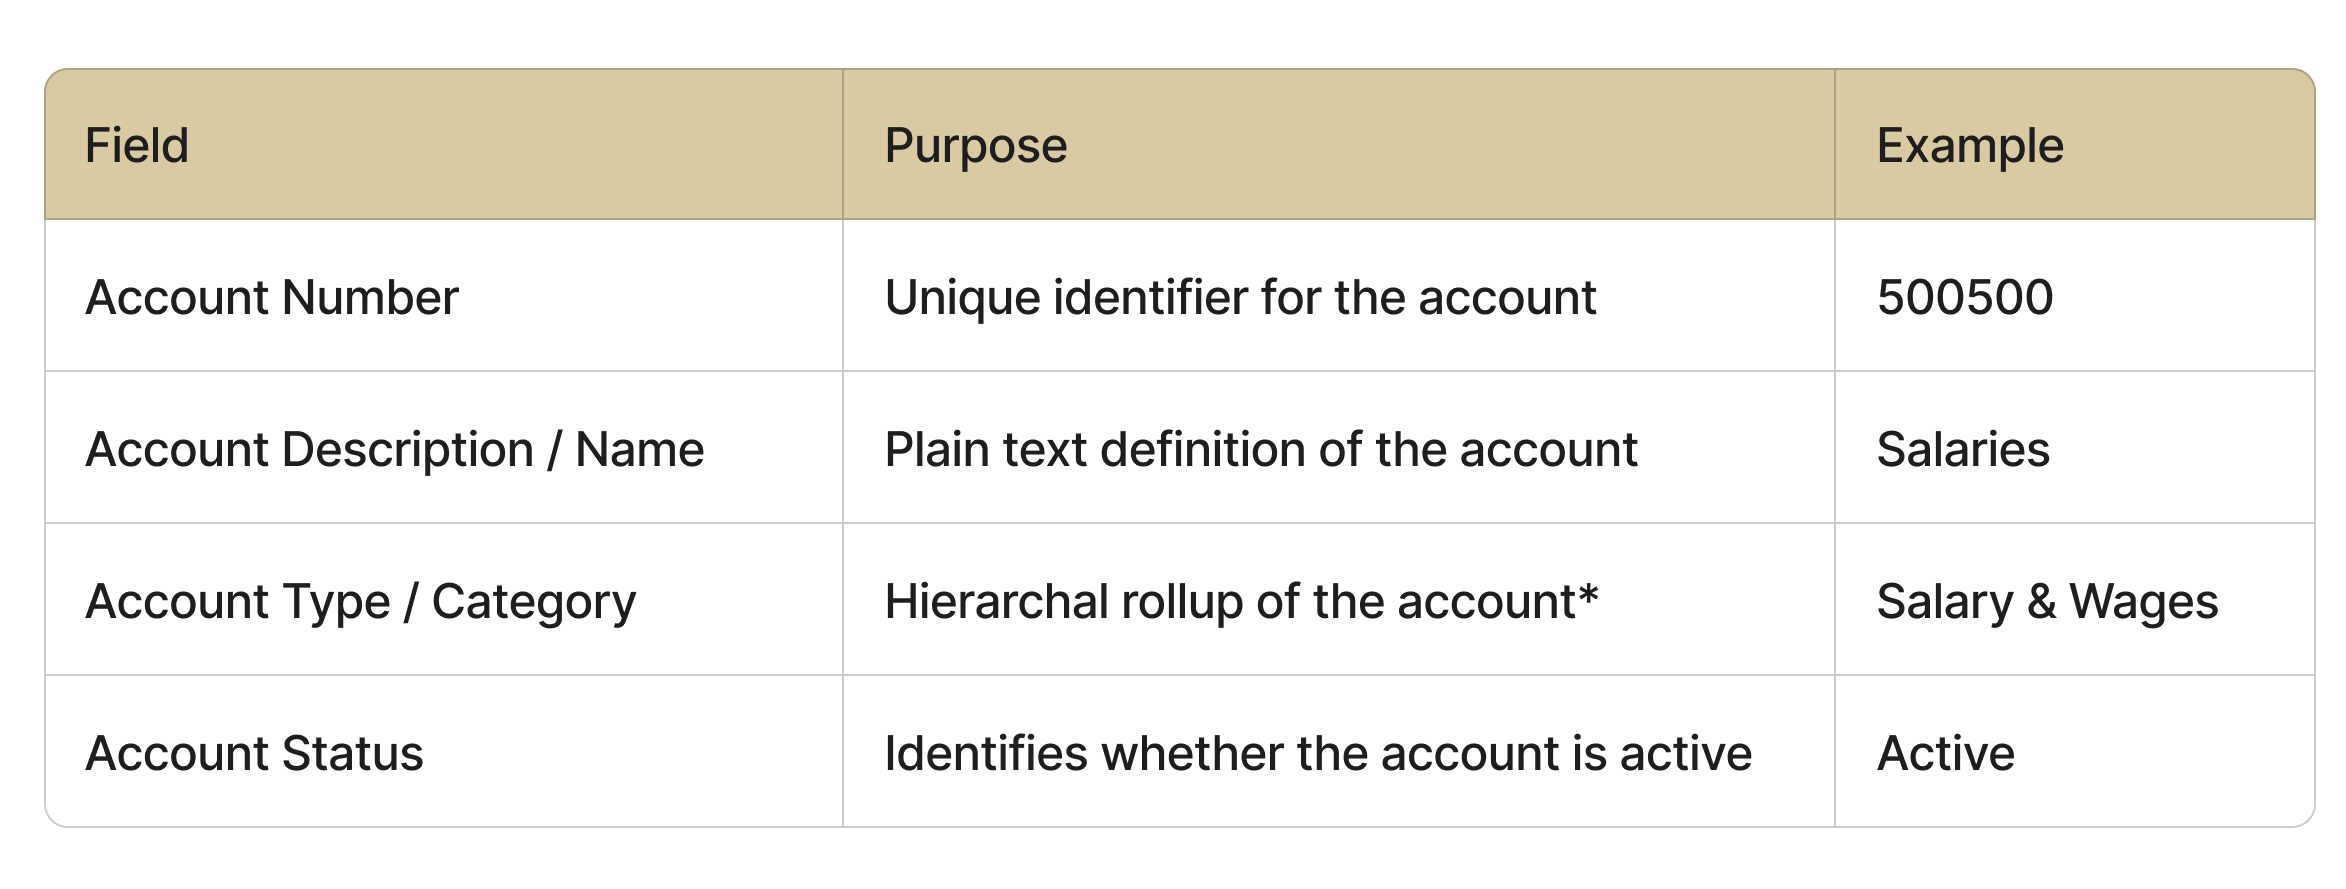
Your job is not to redesign the hierarchy, instead connect with your Finance team to understand it well enough to map it to cost pools consistently.
This is a perfect opportunity to start building a relationship with Finance if you haven’t started already. Set an introductory meeting, introduce what you’re working on, and how the cost model being constructed will help the organization achieve specific strategic goals.
How to Read a Chart of Accounts (CoA) Hierarchy
Understanding how to read a Chart of Accounts (CoA) hierarchy is essential before you begin assigning accounts to cost pools. The CoA is more than a list of numbers and descriptions; it’s a structured representation of how the organization categorizes its financial activity. Reading it correctly ensures that cost pool assignments reflect the organization’s actual financial logic rather than assumptions or guesswork.
A CoA hierarchy typically includes three elements:
Account identifiers
Account descriptions
Parent–child rollups
Together, these elements show how detailed accounts roll up into broader financial categories.
Account Identifiers
Every account has a unique identifier which is usually a numeric or alphanumeric code. This identifier tells you:
where the account sits in the hierarchy
which financial segment it belongs to
whether it represents a specific type of spend
Examples:
500500 Salaries
612300 Software Subscriptions
645100 Cloud Hosting Services
The identifier itself may encode meaning (e.g., “500xxx = labor”), but this varies by organization. Check with Finance to understand how they interpret the structure, since the hierarchy doesn’t always carry the meaning it appears to.
Account Descriptions
The description is the plain‑language label for the account. This is your first clue about what the organization actually purchased.
Examples:
“Salaries”
“Computer Hardware – Laptops”
“Professional Services – Consulting”
Descriptions are not always perfect. Some are outdated, overly broad, or inconsistent. It’s worth checking with Finance on anything that’s unclear because they can usually explain how the account is meant to be understood. This kind of cross‑functional validation supports accuracy and shared understanding.
Parent–Child Rollups
Most CoAs include hierarchical groupings that show how detailed accounts roll up into broader categories. These rollups may appear as:
Account Type
Account Category
Parent Account
Summary Account
Header or Node
Level 1 / Level 2 / Level 3 Categories
A typical hierarchy might look like:
→ Operating Expenses
→ → Salary & Wages
→ → → 500500 Salaries
These rollups are important because they reveal the organization’s financial logic and help you understand how Finance interprets spend.
When assigning accounts to cost pools, you should always consider both the child account and its parent grouping. If the child description is unclear, the parent category often clarifies the intended meaning.
The Cost Pool List
The second dataset is the list of cost pools your organization will use. These are the categories of spend that represent what the organization buys like labor, hardware, software, cloud, services, facilities, telecom, internal allocations, and so on.
Organizations typically align their cost pool labels to:
Internal financial policies
Industry frameworks they follow
Public‑domain classifications such as NIST SP 800-53 and NIST SP 500-292
Primary Cost Pools
To provide a consistent, framework‑agnostic foundation, the cost pools below are adapted from NIST’s public‑domain classifications of hardware, software, services, cloud, and supporting components. While many organizations adopt cost pool structures from frameworks such as TBM, FinOps, or internal financial policies, this NIST‑aligned list offers a neutral baseline that can be used regardless of which framework is in place.²
Labor — Personnel resources required to deliver, operate, or support information systems, consistent with NIST’s definition of personnel security and operational roles.
Professional Services — External services supporting system development, implementation, assessment, or operations, aligned with NIST’s treatment of external service providers and shared service relationships.
Hardware — Physical information system components such as servers, storage, networking devices, and endpoints, aligned with NIST’s definition of information system components.
Software — Applications, platforms, and system software, including licenses and maintenance, consistent with NIST’s categorization of software components.
Cloud Services — IaaS, PaaS, and SaaS services as defined in NIST SP 500‑292, including compute, storage, networking, and cloud service provider roles.
Telecom — Network and communication services, circuits, mobile services, and unified communications, aligned with NIST’s communications and network component definitions.
Facilities — Data center space, power, cooling, and physical environment controls, consistent with NIST’s physical and environmental protection categories.
Internal Allocations — Costs allocated to IT from other organizational units, aligned with NIST’s recognition of shared services and organizational dependencies.
Depreciation and Amortization — Depreciation of capitalized hardware and amortization of software or implementation costs, consistent with NIST’s treatment of system lifecycle and asset management.
Other Technology Spend — Low‑volume or uncategorized technology spend that does not fit into the primary NIST‑aligned categories.
Constructing a Cost Pool Reference Dataset from the Chart of Accounts
Rather than tagging individual transactions directly each time financial data is added or refreshed in the model, creating a reference dataset captures the logic in a way that is transparent, defensible, and repeatable. This approach enriches the Chart of Accounts (CoA) with the Cost Pool attributes. The idea is to take what is already known about each account — what it represents, how it is used, and how it fits into the organization’s financial structure — and use that knowledge to build a stable reference that can be applied across periods and financial datasets. This creates a durable mapping between the CoA and the cost pool structure, allowing the same logic to be reused without re‑classifying transactions each cycle.
Constructing the reference dataset involves four steps:
Review each account in the CoA — Understand the nature, intent, and financial role of the account by examining its description, hierarchy, and usage.
Determine which cost pool best represents what the organization bought — Apply a classification method that aligns accounts to the cost pool that most accurately reflects the underlying spend.
Apply the classification to the CoA master data — Enrich the CoA extract with the assigned cost pool attribute, creating a structured reference dataset.
Validate the results with Finance — Confirm that the classifications reflect how the organization records and interprets its spending.
Validating the reference dataset with Finance creates an early opportunity for strategic alignment by including them in the discovery and attribution process. Their knowledge of account usage, rollups, and financial intent ensures accurate classifications and builds credibility that supports operational adoption in later stages.
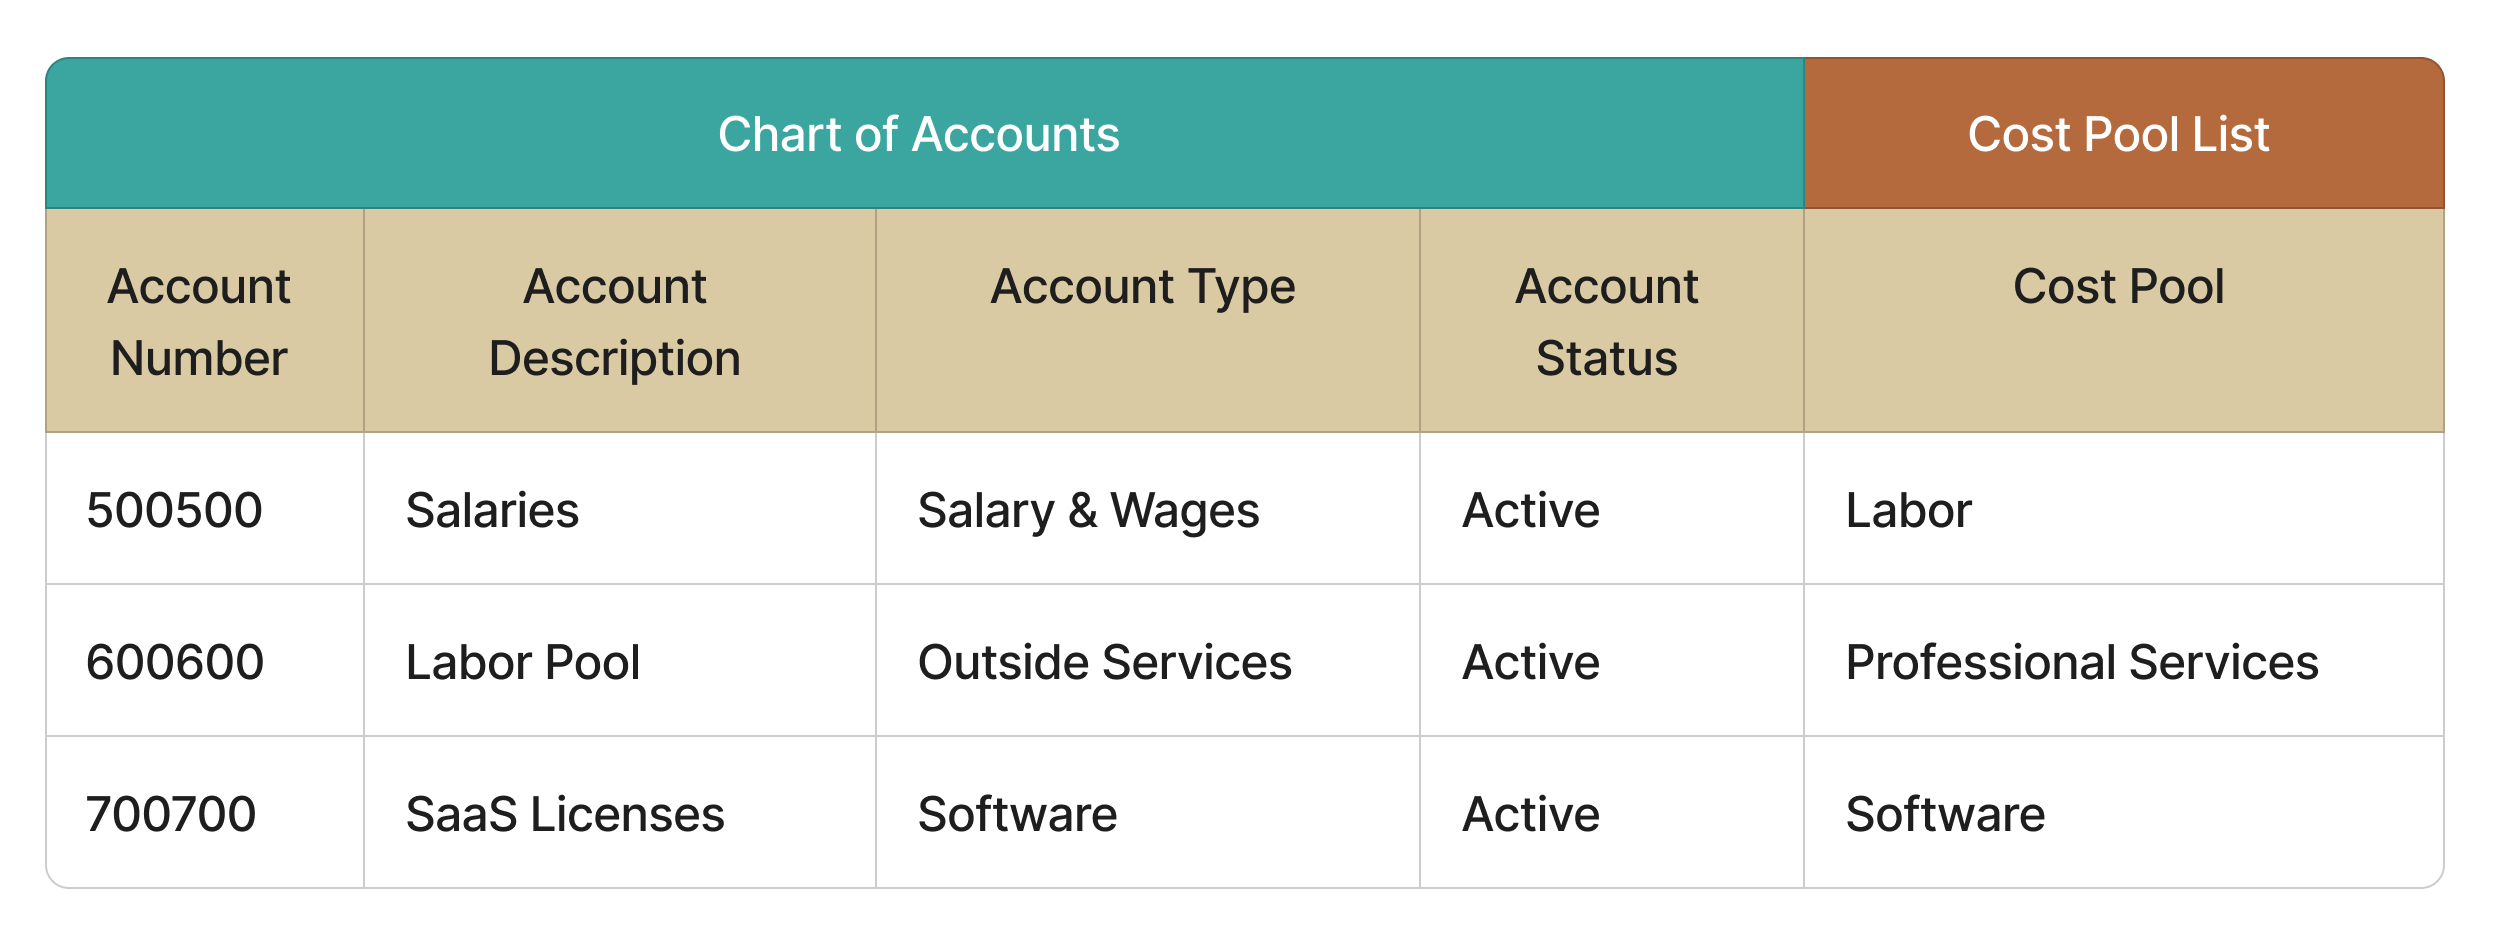
The result is a structured, reusable reference framework that ensures financial data is classified accurately and consistently during modeling. Your reference dataset may look something like:
Because the logic is applied at the account level, not the transaction level, it remains stable across periods, reduces rework, and provides a clear audit trail for how costs are grouped and interpreted within the model.
Applying the Cost Pools Reference Dataset to Financial Data
Once the Cost Pools reference dataset is complete and validated with Finance, the next step is to apply it to the organization’s financial datasets. This is done by joining the reference dataset to the actuals, forecast, and budget using the shared account identifier. Because the classification logic lives outside of the transactions, the model classifies costs consistently every time. When a new account is added or an existing one changes, the reference dataset is updated once, and the change flows through automatically the next time the model runs. This keeps the process clean, governed, and easy to maintain.
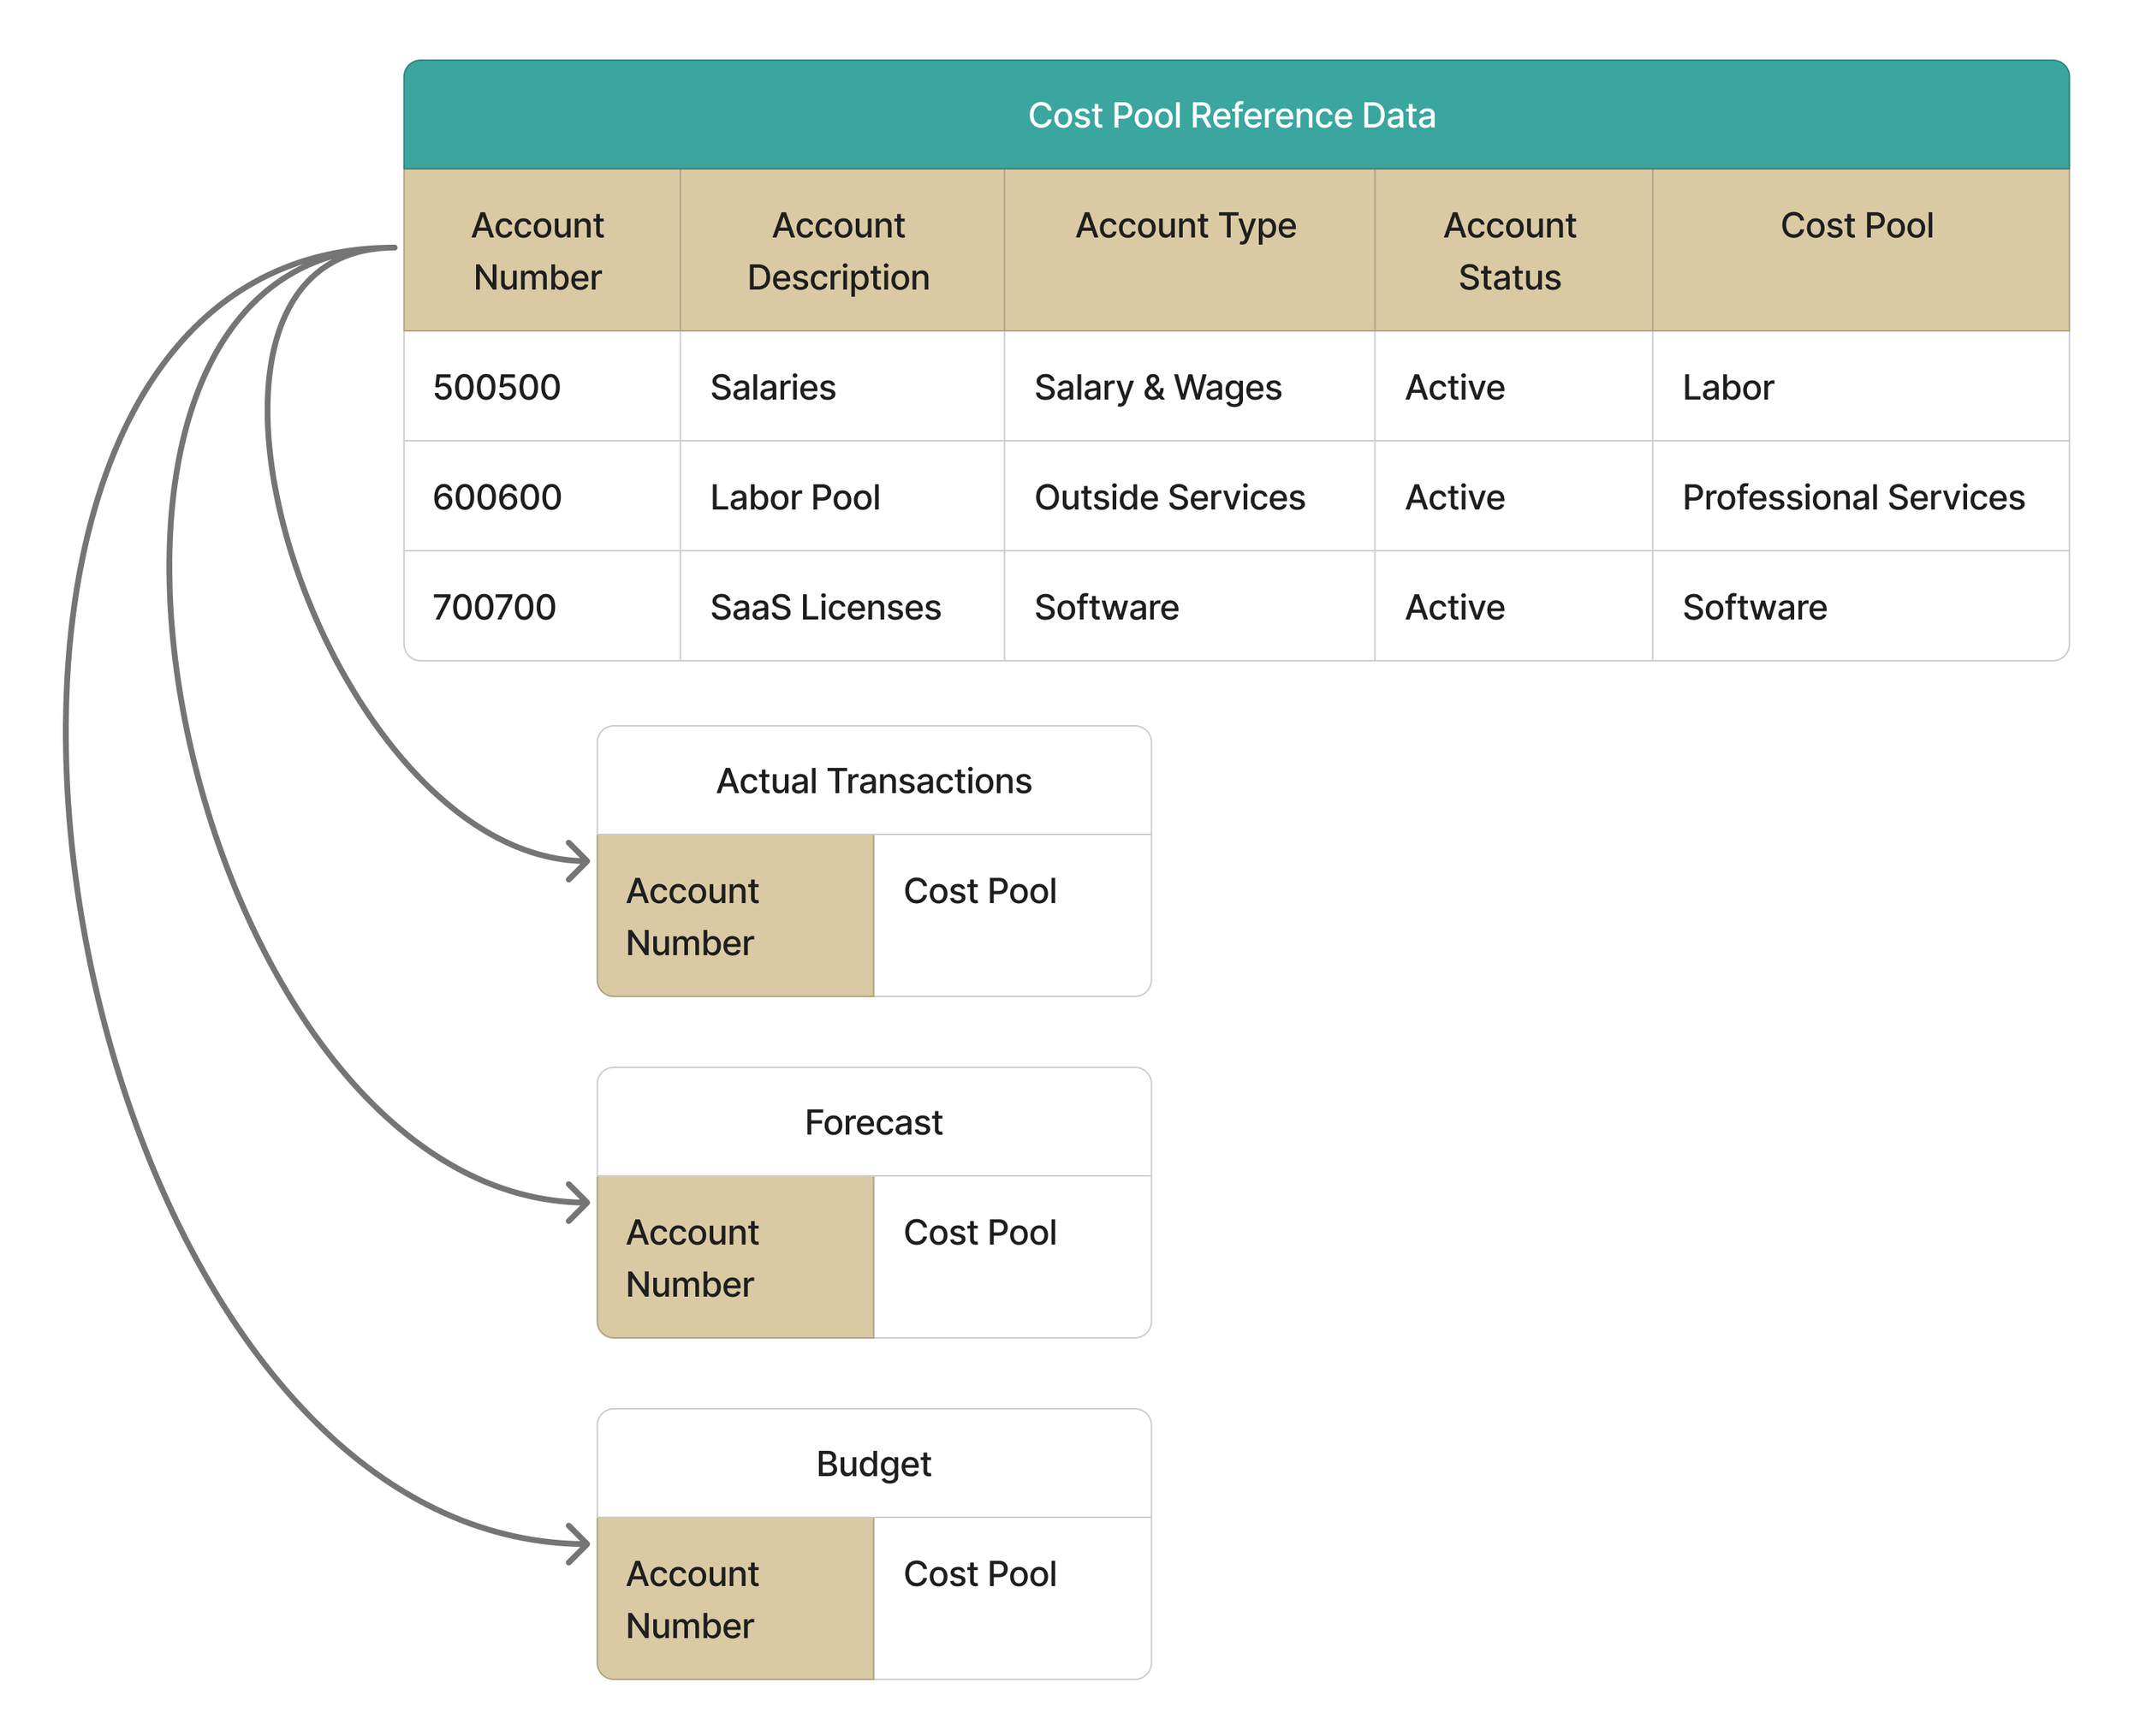
Your account identifier should be an element of metadata that is present in the generated cost pools reference dataset and the financial datasets for actual transactions, forecast, and budget. This may be simply the account number, or a concatenation of multiple fields to create a unique identifier. The result is expected to be a one-to-many relationship where each account is attributed with only one cost pool, and that cost pool applies to many transactional lines within the financials.
Because the classification logic lives outside of the transactions, the model classifies costs consistently every time. When a new account is added or an existing one changes, the reference dataset is updated once, and the change flows through automatically the next time the model runs. This keeps the process clean, governed, and easy to maintain.
Obtaining the Financial Datasets from Source Systems
The financial data used in this step must come from the organization’s system of record and should be complete, accurate, and governed. These datasets form the foundation for all downstream analysis, allocation, and reporting. Working with Finance to identify the correct datasets, establish a refresh cadence, and define a sustainable governance process deepens alignment and builds trust in the model.
Financial datasets for this stage typically include:
Actual transactions
Forecast data
Budget data
These may originate from the same system or from different modules within the financial ecosystem.
Work with Finance to determine which fields are available in each dataset; it is better to ask for more than you need and disregard unused dimensions, than to request additional fields mid-cycle. At a minimum the financial datasets should include when available:
Account Number
Account Description / Name
Cost Center / Organization Identifiers
Posting Date / Fiscal Period
Transaction Amount
Transaction Description
Vendor ID / Vendor Name
Purchase Order or Project Indicators
Any fields Finance or Procurement use to interpret spend
This is also an ideal moment for a knowledge transfer session with Finance. Understanding how Finance uses the source data to produce reporting ensures continuity when the cost pool dimension is introduced. Any known data challenges should be captured — these become opportunities for improvement as the model matures.
Document the process clearly: the source data, where it comes from, who provides it, the fields included, the delivery schedule, any preparation steps, and a sample reconciliation. This documentation strengthens sustainability and helps others understand how the model operates.
Joining the Reference Dataset to Financial Data
The join itself is straightforward: financial datasets contain the same account number or account identifier that appears in the CoA. By linking transactions to the reference dataset on that shared field, each transaction inherits the cost pool assigned to its account. The reference dataset functions as a lookup table that enriches financial data with consistent attribution.
This step is the bridge between financial data and modeling. It transforms ledger entries into structured, categorized inputs that the model can use reliably. Because the reference dataset is governed and validated, the classification is transparent, defensible, and easy to explain to stakeholders.
The same logic applies to budgets and forecasts. As long as the account identifier is present, the cost pool attributes can be applied. This consistency across financial views is one of the major advantages of using a reference dataset rather than tagging transactions directly in each dataset.
The First Technology Centric View of Spend
At this stage, the introduction of cost pools provides the first technology centric view of spend and financial performance. Beyond traditional accounting dimensions, cost pools help answer questions such as:
How much is being spent on hardware or software/SaaS?
How does this compare to expectations?
Finance already understands these distinctions, but the shared structure created through this process enables a common language and deeper alignment between financial and operational stakeholders.
Governance and Partnership with Finance
The sustainability of the model depends on a cross functional partnership between Technology and Finance. For the segment of the model constructed so far to be operationalized and reliable, develop a set of processes with Finance that address the shared ownership of data quality.
Finance owns the source data and will need to communicate changes in data structure, adds and deletes to the Chart of Accounts, and changes to the data availability cadence — define a change management process.
Finance already maintains processes to deliver financial reporting for a variety of use cases and audiences. Establish a process for receiving actual, forecast, and budget transactional data on an appropriate regular basis.
The datasets provided by Finance will likely be received at different times in alignment with existing financial close and planning cycles. It is important to confirm that dollar amounts remain in agreement with those in the system of record. Work with Finance to define a repeatable validation process.
Engaging Finance early and consistently builds trust, reduces rework, and ensures the model becomes part of the organization’s financial rhythm rather than an external artifact. This partnership transforms the cost pool layer from a technical exercise into a sustainable, governed capability.
Notes on Documentation and Credibility Building
Document the generated cost pools reference dataset including the names and roles of the peers and partners that may have advised or validated the classifications.
Any data processes developed with Finance should be documented in a way that includes important details like what the source data is, where it comes from, who is responsible for providing it, the fields included, the delivery schedule, and any data cleansing steps required.
Documenting the workflows or change management agreements will be helpful in ensuring the cost model being built can sustain organizational disruption like new hires or separations within the contributing teams and can also be helpful in future conversations where the cost model’s development may need to be explained or defended.
Cost Model Snapshot
This snapshot represents the model as it stands at the end of Segment 1: a governed reference dataset, authoritative financial inputs, and a repeatable process that joins them into a consistent, technology aligned view of spend. With these relationships in place, the model has moved from concept to functioning system that classifies costs predictably, explains its logic transparently, and provides a stable foundation for deeper analysis.

From here, the cost pool assignments can be leveraged to build directly on this foundation by translating cost pools into meaningful financial and operational views. Segment 2 will examine each major cost category — labor, fixed assets, vendor spend, and other costs, to identify the data, metadata, and usage patterns that reveal how technology is built, consumed, and supported. This is where generated attributes and technology centric tags begin to take shape, setting the stage for the benchmarkable classifications introduced in Segment 3.
¹﹠²Adapted from IT asset and service classifications defined in NIST Special Publication 800‑53, Revision 5 (public domain), National Institute of Standards and Technology, U.S. Department of Commerce.
Prefer a downloadable version? Use the form below to get the PDF.